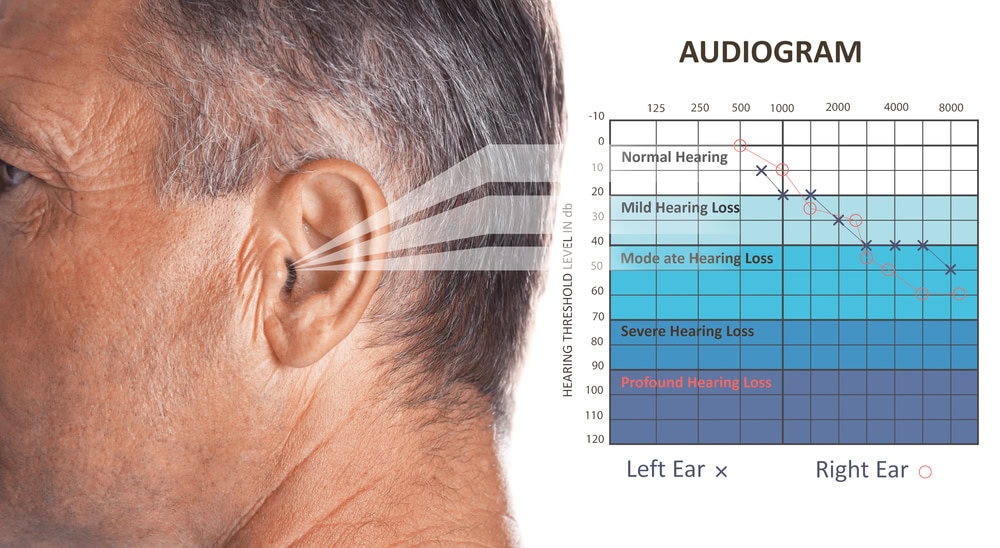
Audiogram
An audiogram is a graph that visually represents an individual’s hearing sensitivity across different frequencies and intensities. It is the primary tool used by audiologists to diagnose and characterize the extent and type of hearing loss. The audiogram is generated using results from a hearing test, which measures how well a person can hear sounds at various pitches (frequencies) and volume levels (intensities).
How an Audiogram Works
During a hearing test, an individual is exposed to sounds that vary in frequency and intensity through headphones. The person indicates whether they can hear each sound, and the responses are charted on the audiogram. The frequencies tested typically range from low (250 Hz) to high (8000 Hz), mimicking the range of human speech and other common sounds. Intensity levels are measured in decibels (dB).
Understanding the Audiogram
The audiogram is plotted on a grid:
- Horizontal Axis: Represents the frequency of sounds, measured in Hertz (Hz). Frequencies increase from left (low-pitched sounds) to right (high-pitched sounds).
- Vertical Axis: Represents the intensity or loudness of sounds, measured in decibels (dB). The top of the axis indicates softer sounds, progressing to louder sounds at the bottom.
On the audiogram, hearing sensitivity at each frequency is marked by specific symbols to represent the softest sounds an individual can hear, known as their threshold of hearing. Common symbols used include ‘O’ for responses from the right ear and ‘X’ for the left ear.
Types of Hearing Loss as Shown on an Audiogram
The shape and pattern of the marks on an audiogram can indicate different types of hearing loss:
- Conductive Hearing Loss: Typically shows as a flat pattern where all frequencies are equally hard to hear.
- Sensorineural Hearing Loss: Often appears as a slope; higher frequencies are harder to hear compared to lower ones.
- Mixed Hearing Loss: A combination of conductive and sensorineural loss patterns.
Importance of Audiograms
Audiograms are crucial for several reasons:
- Diagnosis: They help in diagnosing the type and severity of hearing loss.
- Treatment Planning: Based on audiogram results, audiologists can recommend appropriate treatments, such as hearing aids, or refer for medical treatment if necessary.
- Baseline Information: For individuals in occupations exposed to noise, periodic audiograms can track any changes in hearing over time, aiding in preventive measures.
Conclusion
An audiogram is a fundamental tool in audiology, essential for accurately assessing and managing hearing health. It provides a detailed visual representation of hearing ability, crucial for diagnosing hearing conditions and planning appropriate interventions. Understanding how to read an audiogram is important for anyone undergoing hearing tests, as well as for professionals managing hearing health.